If you spend your day knee-deep in Excel or Google Sheets formulas, pivot tables, and chart tweaking, you know how quickly the hours can slip away. You might be fixing a chart that refuses to update or searching for a formula that you’ve already looked up three times this week.
What if you could just ask your spreadsheet for the answer, and it created the code, chart, or formula for you?
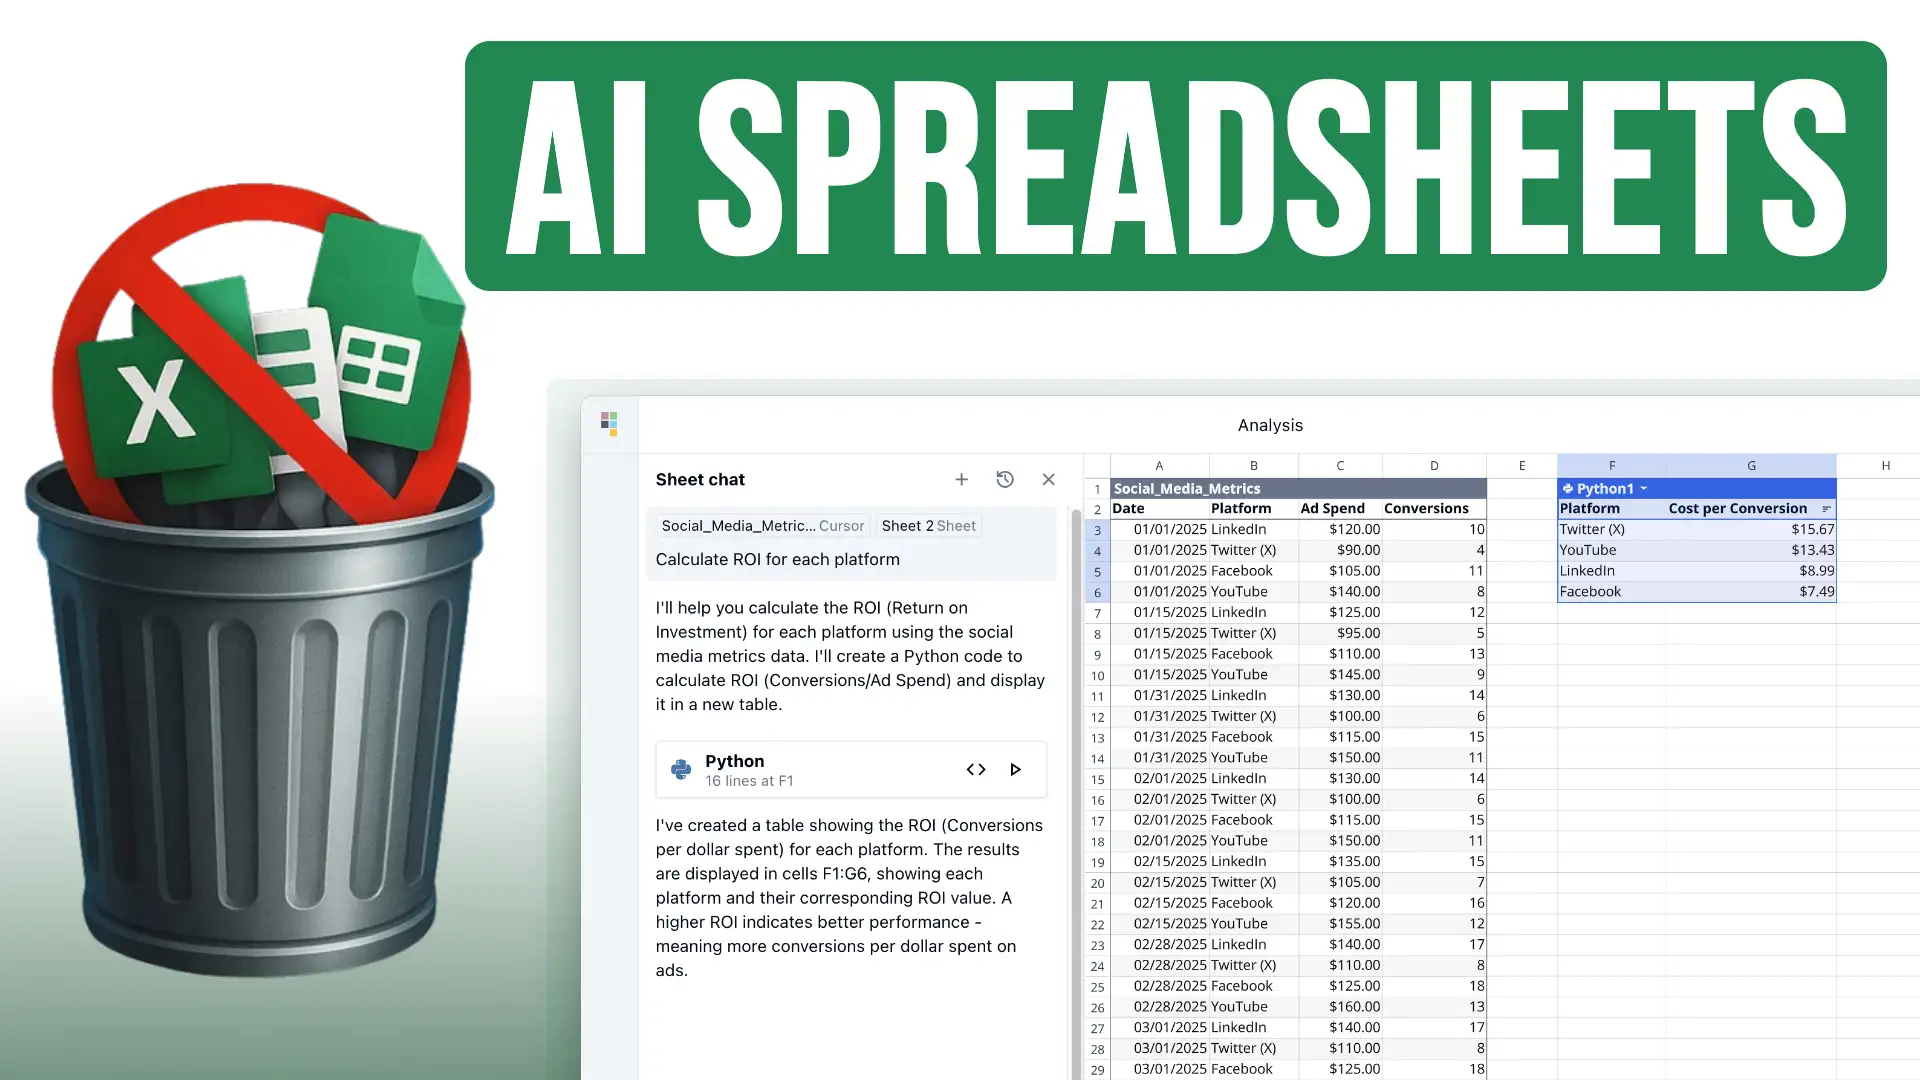
Meet Quadratic, an AI-powered spreadsheet that combines the flexibility of Python and JavaScript with the familiar layout of traditional sheets.
Getting Started with Quadratic
Quadratic is a browser-based spreadsheet tool. On the homepage, you’ll find options for analysis, charts, models, reports, and dashboards. It also supports real-time collaboration, making it ideal for teams.
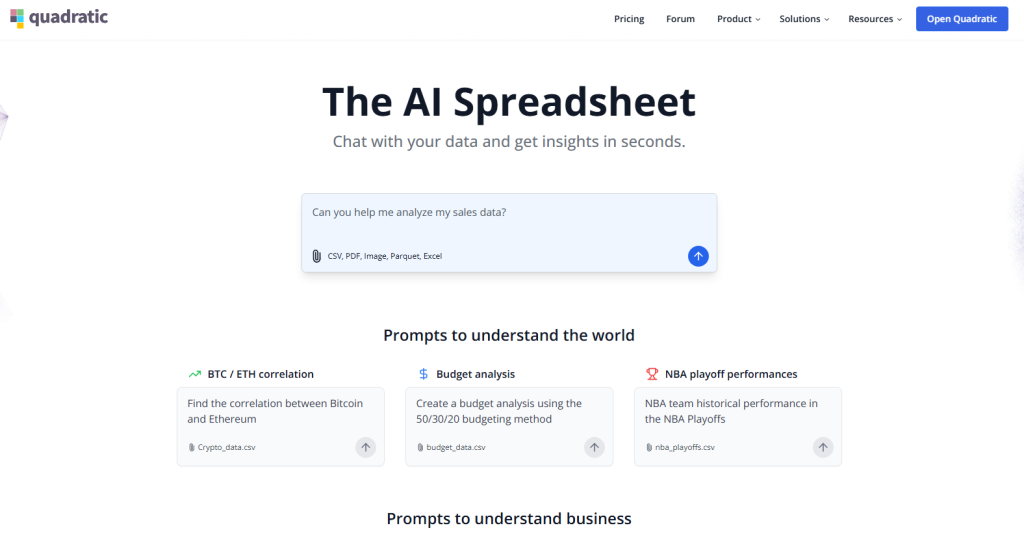
Click Open Quadratic in the top right. If you don’t have an account, signing up only takes a few seconds. Once you’re in, click New File to start a blank spreadsheet.
What you’ll see is a familiar grid layout with rows, columns, a formula bar at the top, and toolbar icons that will remind you of Excel or Google Sheets.
Importing Data into Quadratic
To test it out, we’re using a sample CSV file with over a thousand rows. It contains columns like:
customer_idorder_idshop_idregionproduct_nameproduct_priceamount_soldorder_date
Click Import, select the CSV, and Quadratic loads everything neatly into the sheet.
Asking Questions with AI
Quadratic’s real magic happens through Sheet Chat. You can type questions like:
Show me the revenue from each region and what percentage each region contributes to the total.
Quadratic processes your request, generates the Python code behind the scenes, and adds a clean table with the results.
It also suggests follow-up prompts, such as creating a chart.
Let’s click on the suggested chart prompt. Quadratic builds a bar chart next to your table, helping you instantly visualize the data.
Real-Time Updates in Action
One of the most impressive features is live updating. Change the amount_sold value in a single cell, and the table and chart update immediately. There’s no need to refresh or manually rerun anything.
Discovering the Top-Selling Products
Want to see your top products?
Ask: Show the top 10 most sold products.
Quadratic groups the data by product name, sums up the amounts sold, sorts the list, and displays the results in a new table. You can also request a chart of this data, and it builds one for you on the spot.
Viewing and Editing the Python Code
To see how it works behind the scenes, click the Code icon in the sidebar.
You’ll see the Python code that was used to generate your result. Want to tweak it?
Just ask: Modify this code to find the top 10 products by sales for each region.
Quadratic rewrites the code for you, and after you approve it, the spreadsheet updates automatically.
Try JavaScript Mode (Experimental)
Quadratic also supports JavaScript in experimental mode. Click the code button, and switch the language from Python to JavaScript.
For example, ask:
Create a top 3 customers list based on the amount of orders.
Quadratic will output JavaScript code that does exactly that. It might need a few tweaks and reruns, but the feature is promising and actively being improved.
Connecting to Databases
If your data lives outside of spreadsheets, Quadratic also lets you connect to databases like:
- PostgreSQL
- MySQL
- SQL Server
- Snowflake
Click the Database icon, set up a connection, and use Sheet Chat just like you would with imported data.
Built for Teams
Quadratic includes powerful collaboration features. You can invite your team by email, and everyone will see the same data, charts, and code in real time.
No more emailing spreadsheets back and forth or dealing with version conflicts.
Final Thoughts
Quadratic is a great option for anyone working with spreadsheets daily. It combines ease of use with advanced automation, helping you save time and eliminate repetitive tasks.
Whether you’re creating quick visualizations or diving into Python-powered analysis, Quadratic makes the process smooth and intuitive.
Or Watch the Video Here
🎥 https://youtu.be/jU6LMuFbxmk
Disclaimer: This post is not sponsored or affiliated with Quadratic. We do not receive any commission or compensation for mentioning or linking to their platform. All opinions and impressions shared are our own, based on hands-on use.