
Most Excel users learn PivotTables the same way: insert one, drag a few fields around, and hope the output makes sense. Sometimes it does, often it doesn’t. The issue is not the tool, PivotTables are one of the most powerful features in Excel. The issue is that they are usually approached as a mechanical task instead of an analytical one.
Learning how to use PivotTables in Excel properly is less about clicking and dragging, and more about understanding what question you are trying to answer and how your data is structured to support that answer. This guide focuses on that distinction. Not just how PivotTables work, but how to use them for actual analysis.
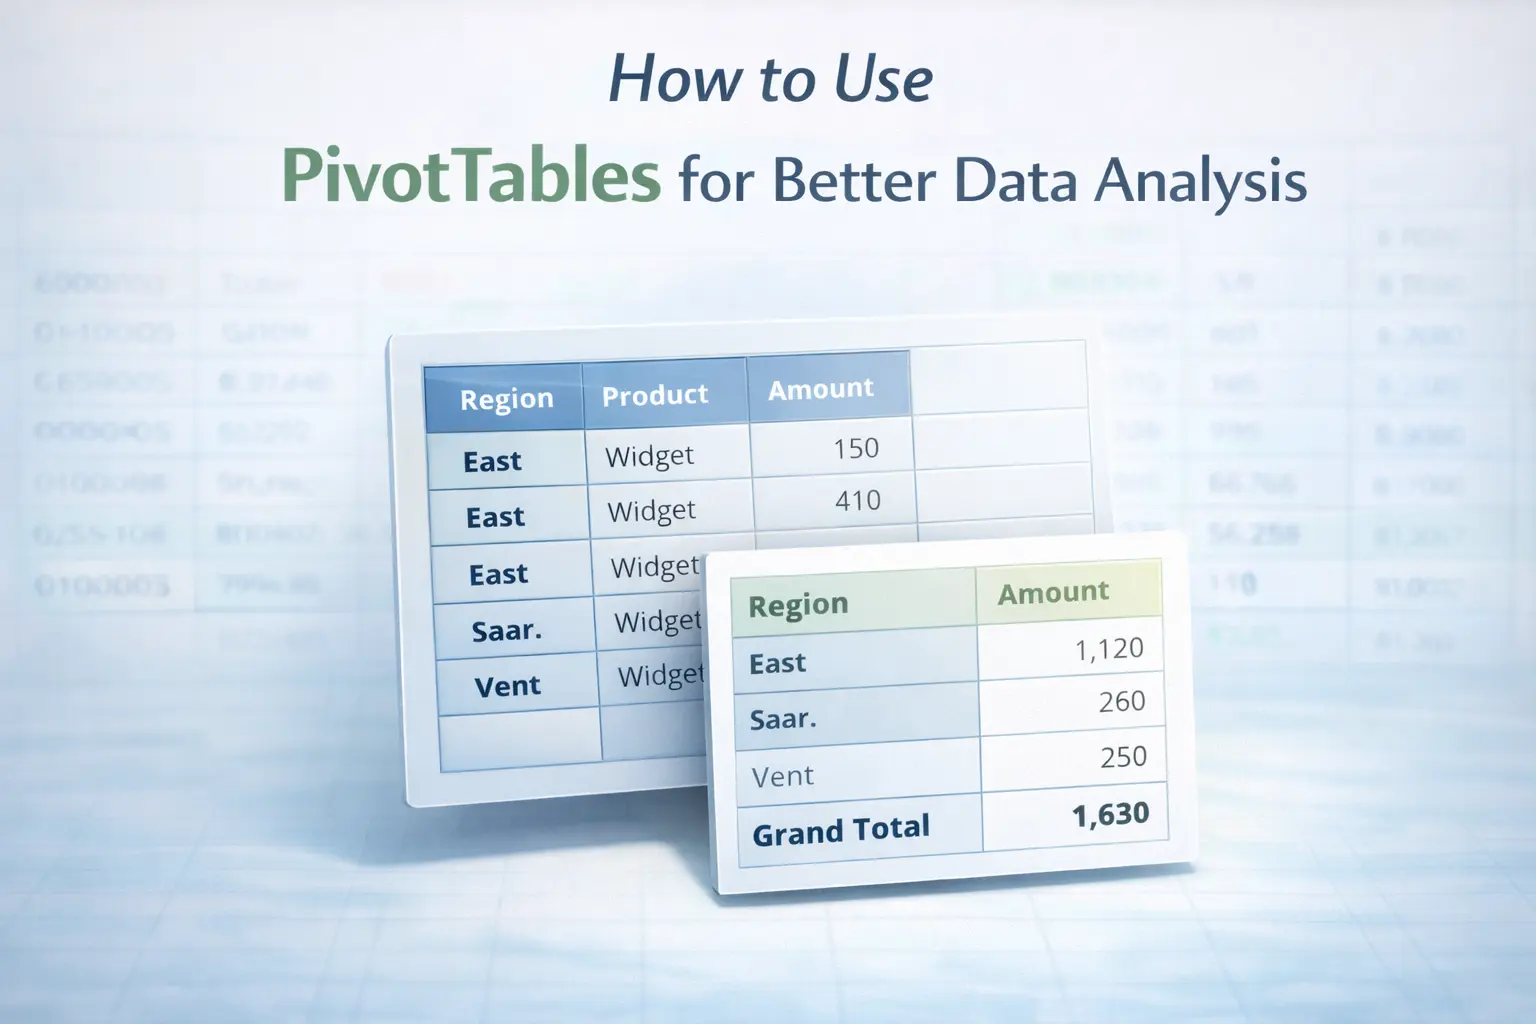
What a PivotTable Actually Does
At its core, a PivotTable is a way to reorganize data without changing the original dataset. That sounds simple, but it has important implications. Instead of editing rows, deleting duplicates, or restructuring columns, you are creating a new layer that summarizes the data based on a chosen perspective. You decide how the data is grouped, what gets calculated, and how the result is presented.
This is fundamentally different from most Excel operations. You are not modifying the data. You are interpreting it. That distinction becomes critical as soon as your dataset grows beyond a few dozen rows.
Start With a Question, Not a Table
The most common mistake is creating a PivotTable before knowing what you want from it. That leads to:
- random field placement
- meaningless summaries
- unnecessary complexity
A PivotTable should always answer a specific question. For example:
- What are total sales per month?
- Which products generate the highest revenue?
- How do regions compare over time?
Once the question is clear, the structure of the PivotTable becomes obvious. Rows define how you group the data. Values define what you measure. Columns and filters refine how the result is viewed. Without a clear question, a PivotTable is just a rearranged dataset.
Structure Matters More Than Features
A PivotTable is only as reliable as the data behind it. If your dataset contains:
- blank cells
- inconsistent categories
- numbers stored as text
- duplicate or fragmented entries
your PivotTable will reflect those issues, often without making them obvious. That is why data cleaning comes first. If your numbers behave unexpectedly or totals look incorrect, it is rarely a PivotTable problem. It is a data structure problem. PivotTables do not fix bad data. They expose it.
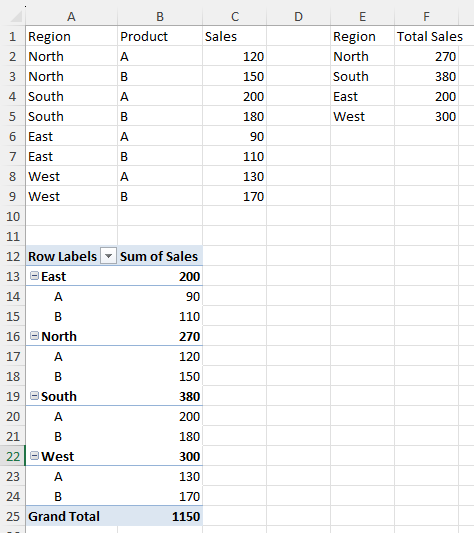
Build the PivotTable Around the Data, Not the Other Way Around
Once your data is clean and your question is defined, building the PivotTable becomes straightforward. You are essentially mapping your dataset into three dimensions:
- Rows: how the data is grouped
- Values: what is being calculated
- Columns or Filters: how the result is segmented
For example, if you want to analyze sales performance:
- Rows might represent products or categories
- Values might calculate total revenue
- Columns might represent time periods
This structure allows you to look at the same dataset from multiple perspectives without rewriting formulas or creating separate sheets. That flexibility is where PivotTables become powerful.
Interpretation Is Where the Value Comes From
Creating a PivotTable is the easy part. Interpreting it correctly is where most users fall short. A summary is only useful if you understand what it represents. For example:
- A high total may be driven by a small number of large transactions
- A consistent average may hide variability
- A category may appear important simply because it contains more entries
PivotTables simplify data, but simplification always removes detail. Understanding what was removed is part of the analysis. This is why PivotTables should be seen as a starting point, not a final answer.
Why PivotTables Feel “Wrong” Sometimes
If a PivotTable produces unexpected results, the instinct is often to adjust the fields. In reality, the issue usually lies in the data. Common causes include:
- hidden blanks affecting groupings
- inconsistent labels creating duplicate categories
- numeric values stored incorrectly
- incomplete datasets
This connects directly to the data-cleaning workflow. When the input is controlled, PivotTables become predictable.
A Practical Way to Think About PivotTables
Instead of thinking of PivotTables as a feature, think of them as a lens. The dataset stays the same. The lens changes how you see it. You can:
- group data differently
- change what is measured
- compare categories
- identify trends
All without modifying the source. That separation between raw data and analytical output is what makes PivotTables suitable for reporting and decision-making.
Final Thoughts
Learning how to use PivotTables for better data analysis is not about mastering the interface. It is about structuring your thinking. Start with a clear question. Work with clean data. Build the structure deliberately. Then interpret the result with context. When those pieces are in place, PivotTables stop being a confusing tool and become one of the most reliable ways to understand your data.