
A PivotTable is one of the most reliable tools in Excel. It does not guess, approximate, or behave unpredictably. It summarizes exactly what it is given. So when a PivotTable looks wrong, it usually isn’t. The issue is almost always in the data behind it.
This is what makes PivotTables frustrating for many users. The output feels incorrect, but adjusting fields rarely fixes the problem. The real cause sits upstream, often hidden inside formatting issues, inconsistent structure, or incomplete data.
Understanding why a PivotTable appears wrong is less about fixing the table itself, and more about diagnosing the dataset it is built on.
PivotTables Reflect Data, They Don’t Correct It
A PivotTable does one thing: it aggregates data based on structure. If the structure is flawed, the summary will be flawed in a consistent way. For example:
- If a number is stored as text, it may not be counted
- If categories are inconsistent, they will appear as separate groups
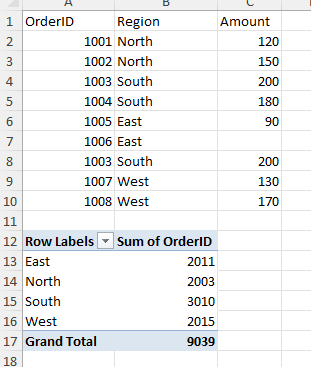
- If duplicates exist, totals will be inflated
- If blank cells exist, groupings may break
The PivotTable is not malfunctioning. It is exposing what already exists. This is why fixing a PivotTable rarely starts inside the PivotTable.
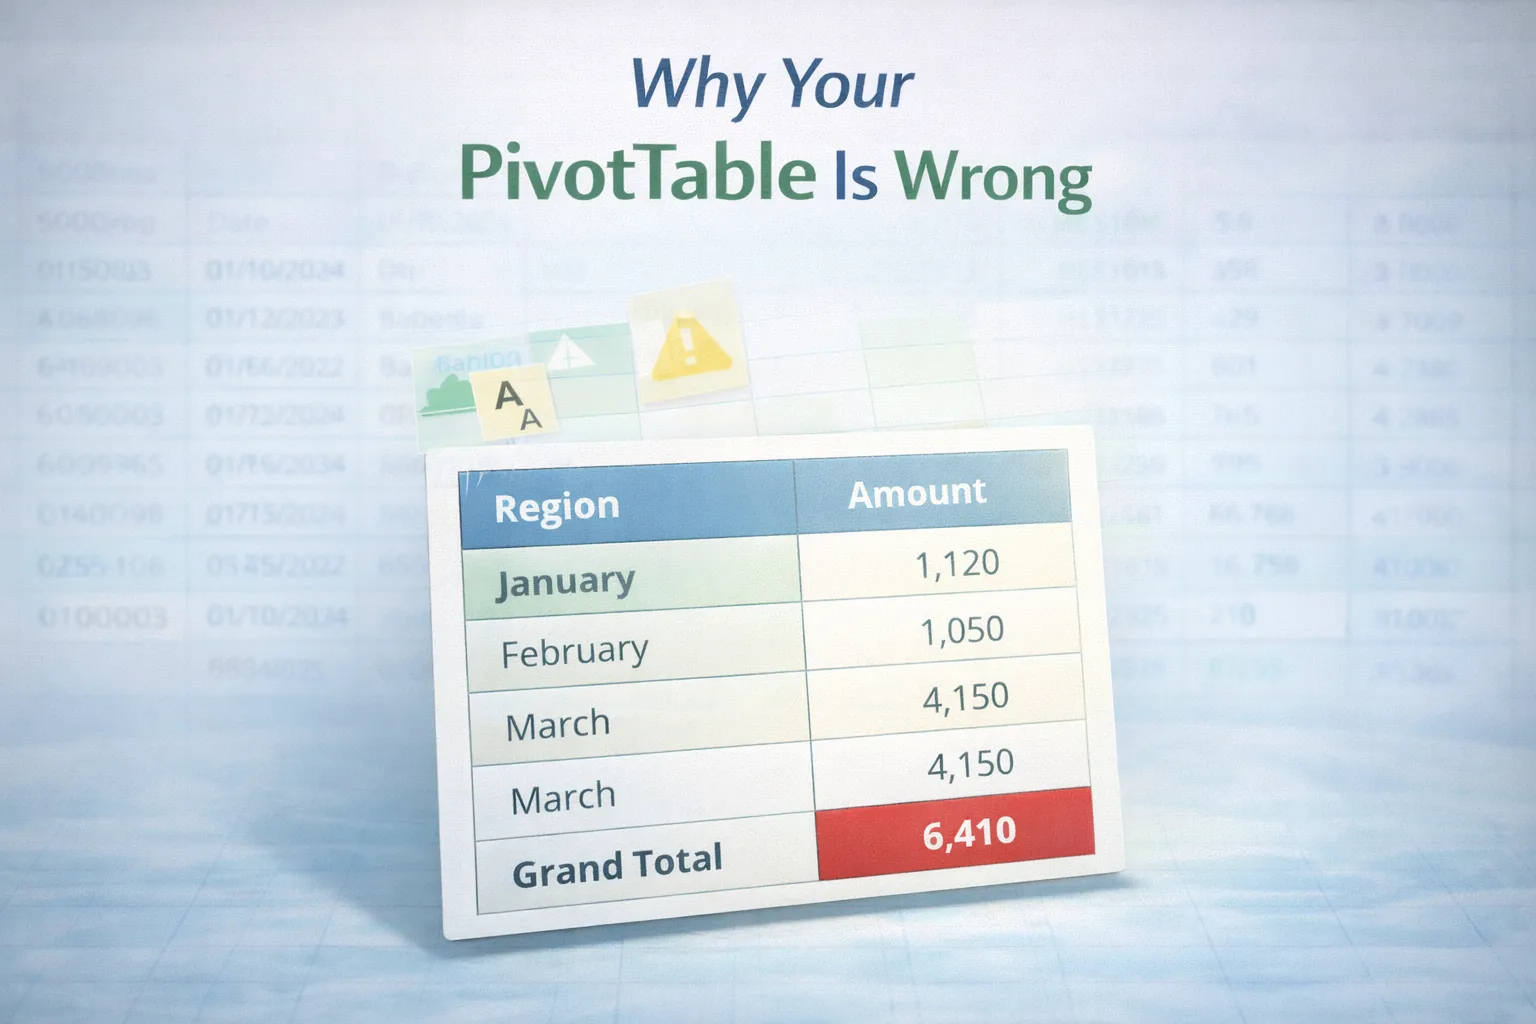
When Totals Look Too High or Too Low
One of the most common signals that something is wrong is an unexpected total. If totals seem too high, the dataset often contains duplicate or repeated entries. This is especially common in exported reports where transactions are logged multiple times or aggregated incorrectly.
Before adjusting the PivotTable, verify whether the source data contains duplicate rows. You should review and clean duplicates at the data level, not inside the summary. If totals seem too low, the opposite is often true. Values may not be included in the calculation at all. This usually happens when numbers are not recognized as numeric values.
Numbers That Look Correct but Aren’t
A value can look like a number and still behave like text. When that happens, PivotTables may:
- ignore the value in calculations
- count it incorrectly
- fail to group it properly
This issue is subtle because the data appears correct visually. If you notice missing values or incorrect aggregation, check whether numeric columns are actually numeric. You need to make sure the underlying data types are consistent, otherwise the PivotTable cannot process them correctly.
Categories That Should Be One but Appear as Many
Another common issue is fragmented categories. For example:
- “North”, “North Region”, and “N”
- “Product A” and “product A”
- trailing spaces or hidden characters
A PivotTable treats these as separate values, even if they represent the same thing logically. The result is a summary that looks inconsistent or incomplete. This is not a PivotTable problem. It is a data consistency problem. Grouping can sometimes help at the PivotTable level, but the better solution is to standardize the source data.
Blank Cells That Disrupt Grouping
Blank cells often cause grouping issues, especially with dates and categories. A PivotTable may:
- create separate blank groups
- fail to group dates correctly
- produce misleading summaries
These blanks may come from incomplete imports or missing values. Before adjusting the PivotTable, identify whether blanks are intentional or structural gaps. You should handle blank cells deliberately at the data level before building summaries.
When the PivotTable Simply Doesn’t Update
Sometimes the issue is not the data itself, but the state of the PivotTable. If new data has been added to the source, the PivotTable will not reflect it automatically unless it is refreshed or properly structured. If your PivotTable is based on a static range, it may not include newly added rows. This creates the impression that the PivotTable is wrong, while it is actually working with outdated data. Keeping data ranges structured and refreshing tables consistently prevents this issue.
Why These Problems Keep Reappearing
Most PivotTable issues are not one-time mistakes. They repeat because the underlying workflow does not change. If data is:
- imported without validation
- cleaned inconsistently
- structured differently each time
the same issues will reappear in every summary. This is why troubleshooting individual PivotTables is less effective than fixing the process that feeds them. A structured workflow ensures that data enters Excel in a consistent, predictable state. You always need to make sure your dataset is clean and structured before analysis, which improves performance and reliability in large workbooks.
The Right Way to Fix a “Wrong” PivotTable
Instead of adjusting fields repeatedly, step back and follow a simple approach:
- Verify the source data
- Check for duplicates
- Validate numeric fields
- Review category consistency
- Handle blank cells
- Refresh the PivotTable
This sequence addresses the actual cause, not just the symptom. Once the data is clean, PivotTables become predictable again.
Final Thoughts
A PivotTable rarely gives the wrong answer. It gives the exact answer to the data it receives. If the result looks incorrect, the issue is almost always upstream. Understanding this changes how you work with Excel. Instead of adjusting outputs, you fix inputs. Instead of reacting to problems, you prevent them. That shift is what turns PivotTables from a confusing feature into a reliable analytical tool.